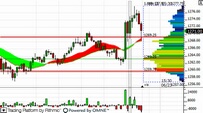
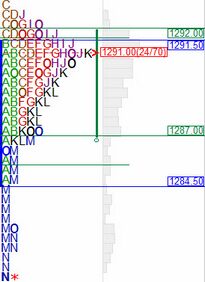
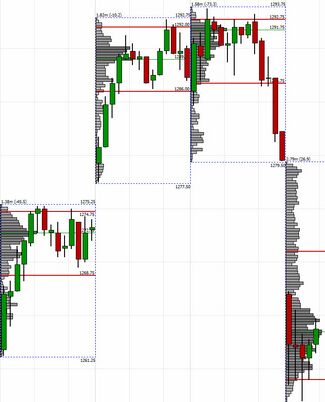
 MarketDelta is the inventor of the Footprint chart. A Footprint® is an individual price painted on the chart with a unique color that contains volume or some other market statistic. Stacking Footprints together creates bars, similar to what any candlestick or bar chart would present. The primary difference, and thus advantage of the Footprint® chart, is it shows each individual price within a bar AND displays value added information such as volume at price, order flow, buy/sell pressure, and other valuable statistics so that you can react quicker and have much greater insight to what is happening.
No more waiting for the bar to close to have an idea what is happening. Footprints help you react quicker because of how they represent the price and volume data.
Overview Marketdelta Charts
Footprint® Charts
MarketDelta is the inventor of the Footprint chart. A Footprint® is an individual price painted on the chart with a unique color that contains volume or some other market statistic. Stacking Footprints together creates bars, similar to what any candlestick or bar chart would present. The primary difference, and thus advantage of the Footprint® chart, is it shows each individual price within a bar AND displays value added information such as volume at price, order flow, buy/sell pressure, and other valuable statistics so that you can react quicker and have much greater insight to what is happening.
No more waiting for the bar to close to have an idea what is happening. Footprints help you react quicker because of how they represent the price and volume data.
Charts, 140+ Technical Studies, & Drawing Tools
With 20 different chart types,140+ technical indicators, and numerous drawing tools, MarketDelta makes it easy to build the charts and layouts you need to succeed as a trader. Lots of options and unparalleled levels of customization help provide the necessary edge to differentiate yourself and to compete in today’s markets.
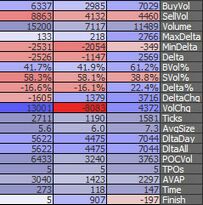
Precision Price and Volume Studies
It is no secret that MarketDelta is the leader in volume analysis, so it only makes sense that we have the best studies, with the best data. Using MarketDelta Trader or one of our other broker feeds? We got you covered with our comprehensive historical backfilling enablement.
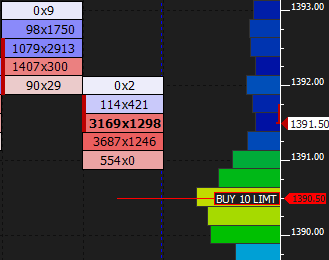
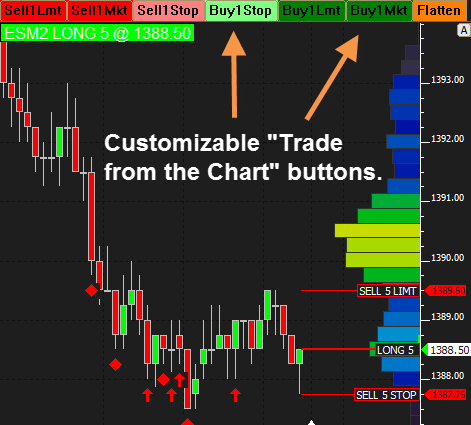
Trade from the Charts
If used with MarketDelta Trader, trades can be placed directly from the chart using customizable buttons OR place trades directly from the DOM in MarketDelta Trader and watch them work on the chart. AS the trades get filled MarketDelta Trader will place brackets automatically for you.
Chart Trading allows a trader to stay focused on his or her charts. If used along with a Footprint chart, you will have the most dynamic view of the market available.
** Chart Trading requires MarketDelta Trader
Customizable Chart Trading Buttons
- Trade directly from the chart
- Setup buttons for custom orders right from the chart
- Initiate, amend, cancel orders
- Lines show working orders
- Lines show open position
- Market on bar shows order information
- Orders also show on the DOM in MarketDelta Trader
** MarketDelta Trader required for order routing.

Lots of Chart Periodicities
MarketDelta is about giving you an edge. Besides the expected periodicities like time, volume, renko, and tick based bars, MarketDelta also offers the ability to create bars based on range, change, delta, POC volume, and others.
Market Profile® and Volume Profiling (Optional enablement)
Add this enablement to your MarketDelta and enjoy the benefits of the most robust Market Profile® and volume profiling technology in the industry.
It adds Market Profile®, the Profile Indicator, long term and composite profile functionality, TPO indicator, Value Area indicator, ability to market high and low volume levels on a profile, and much more. Only $20/mo add- on.
We are an official licensee of the Market Profile® from CME GROUP and are one of the largest resellers of it. Come see why!
Playback or Market Replay
With chart replay you can reinforce patterns deep into your memory so next time they occur profits are maximized and your trading potential recognized. Identify, Practice, Learn, Succeed, Repeat.
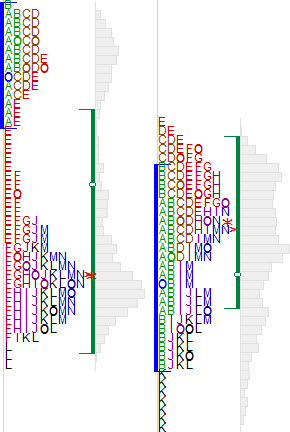
Market Profile® + Footprint® = Greater Awareness & Increased Transparency
Market Profile® offers traders a structure to organize price activity in a logical way and to help see where “value” is being estsablished. Traders typically use Market Profile® charts to determine price levels that are significant and often lead to reversals. When combined with the Footprint® charts, you have two excellent views of the market that complement each other very effectively.
Use the Footprint® charts to confirm if a particular Market Profile® level will hold. Verify your entries and exits by “zooming” in on how the auction is developing at key levels and to make more informed decisions. This increases your confidence as a traders, and also helps time your trades much better.
Our Market Profile® charts offer many features you will not find with other profile vendors:
- Add profiles directly to Footprint® charts
- Use “Heat Map” settings to visualize the distributions more easily
- Draw profiles directly on a chart for any set of bars you wish!
- Dynamically update the start and end bars of a profile by dragging with the mouse
- Know exactly when volume is increasing or decreasing.
- Be in tune as the auction unfolds throughout the day.
- Monitor volume at known reference points.
CBOT Market Profile®
Our powerful Market Profile® offers many features and advanced functionality you won’t find anywhere else. Splits, merges, composites, custom session times, day/night profiles, volume based value area (VA), TPO based value area, point of control (POC) for both volume and TPO, custom-defined initial balance (IB) ranges, initial balance extensions, single prints — the list goes on and on. And, take these levels off the conventional Market Profile® charts and plot them directly on your other charts!
Market Profile® is statistically based and provides an intuitive way to organize market data into readable distributions. Market Profile® provides a logical structure to organize price activity and find where “value” is being created and compare it very easily to previous days.
Market Profile® is also a very valuable tool for identifying the type of auction the market is experiencing. Knowing this alone helps keep traders from fading trends or buying breakouts that never have any follow through.
Market Profile® is a tool developed by Peter Steidlmeyer while he was trading at the Chicago Board of Trade in the 1980’s.
Profile Indicator
One of our most popular indicators, you can accomplish just about anything with it.
- Long term volume profiles
- Automatic high/low volume levels
- Daily and intraday profiles
- Value Area & POC for current day and previous
- Naked POC
- Time or volume profiles
- Compute last X Profiles – this allows for merged profiles.
- Much more.
TPO Indicator
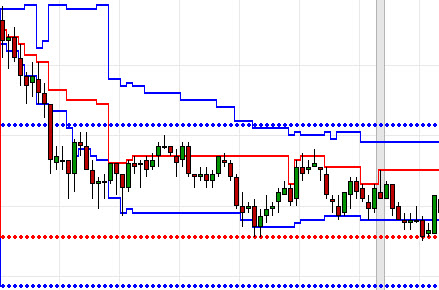
This simple yet powerful indicator will always plot the Value Area and POC for the current day (solid line) and previous day (dotted line) and match up with your Market Profile levels, no matter what time frame you are viewing!
This works very nice for those who like viewing small time frames but want to know exactly where the value area and POC levels are, as well as other profile-related levels.
You can also view developing profiles as price bands for any day in the past; very useful when studying your strategies triggers on other days.
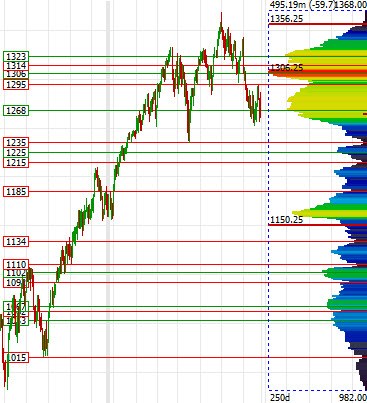
Composite and Long Term Volume Profiles
Never be left guessing what the larger term context looks like. Using data vendors like DTN, intraday historical data is available going back many years.
This chart shows us 250 days of trading,automatically labeling high and low volume levels using a feature called Auto Peak/Valley Lines. These may act as support and resistance.
Much of this analysis is accomplished using our very popular Profile Indicator.
MarketDelta® is routinely recognized as the leader in auction market theory and volume analysis. It’s tools like this that you can see why.
Trading Systems
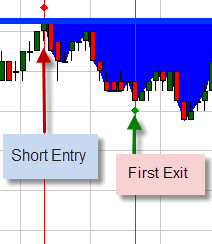
An entire trading system provides the complete set of rules for trade management. You can determine, using backtesting and optimization, which exit strategies are the most effective, and you can also build scale-in and scale-out rules, in addition to stop-loss parameters and more.
Emulate True Trading Results
By building a full, comprehensive trading system, you can accurately analyze how a particular strategy is best implemented. Should you usually hold on for 4 points, or wait for 10? Is it best to sell part of a position early, or is long-term profitability improved by holding until the end of the day? What are the most successful stop-loss settings that minimize losses but with minimal sensitivity to volatility? MarketDelta Pro Complete lets you answer all of these questions and much more.
Backtest Market Profile®, Footprint or other Strategies
Market Profile Testing
Do you trade Market Profile charts and want to know how your approach performs over many months – or years – of data? Building a trading system lets you define exactly how you enter and exit your trades using special RTL tokens we’ve custom-built to follow the Market Profile charting methods pioneered by the Chicago Board of Trade. Then, apply your system to many years of intraday data, or for any time frame that interests you. You can instantly identify which Market Profile levels tend to be the most successful, and which are more subjective.
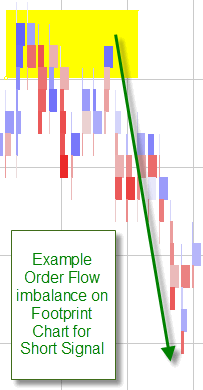
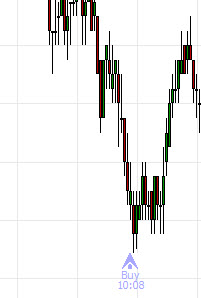
Order Flow Testing
Use the Footprint charts for clarity into the market’s order flow, then build trading systems from the patterns you see. Using RTL, you can directly quantify order flow imbalances and test them against recent tick data. We provide special programming tokens for analyzing volume-at-price statistics, as well as net buying or selling activity in a given bar, or for an entire day.Develop an edge using methods unavailable in any other trading package on the market.
Optimization
If you find levels that perform well in your backtest, take it a step further with Optimization. This lets you clarify exactly how long you should hold onto trades, or how large of a stop-loss to carry, for the best long-term results. Or, the entries themselves may need tweaking. Does the market typically move a point or two against your normal entry? Optimize to test if your entry should be altered slightly so you take the least heat.
Improve Your System
A profitable system can be made even more profitable by letting the software test data and notify you of the best exact hold times, stop-loss levels, entry criteria and more. A creative trader can use Optimization to significantly test many aspects of the entry signal itself and generate entirely new signals you might have never considered.
And, a system that is not yet profitable can often turn profitable by tweaking a few simple parameters that MarketDelta Pro Complete identifies for you automatically.


